
Listings and Sale Stats for Vancouver Real Estate
For all new updates about Vancouver Real estate listings and statistics, please read my bog
Sales stats for the month of January 2013
The New Year has started on better terms than how it finished. With unit sales in January 2013 up from December 2012 and the number of new listings coming on market slowing, the result was the Month’s Supply declining in all areas. Energy in the real estate market is returning and with it sales should continue to increase. While not at levels previously seen in the frenetic markets but creating more of a balance, one that will still favour buyers to a degree. With that pricing continues to be a determining factor on listings selling. Properties listed at today’s prices will speak to buyers more than what continues on market at yesterday’s prices. With interest rates continuing at low levels and better sentiment in the economy, a better positive feeling in the market will help to create a better atmosphere.
Greater Vancouver: Total Units Sold in January 2013 was 1,374 – up from 1,171 in December 2012; New Listings in January 2013 were down 11% to January 2012; Month’s Supply of Total Residential Listings is down to 10 Months from 12 (Buyer’s Market).
Vancouver Westside Houses: Total Units Sold in January 2013 was 83 – up from 49 in December 2012; New Listings in January 2013 were down 31% to January 2012; Month’s Supply of Total Listings is down to 9 Months from 14 (Buyer’s Market).
Vancouver Westside Condos: Total Units Sold in January 2013 was 200 – up from 156 in December 2012; New Listings in January 2013 were down 12% to January 2012; Month’s Supply of Total Listings is down to 8 Months from 10 (Buyer’s Market).
Vancouver Eastside Houses: Total Units Sold in January 2013 was 56 – up from 54 in December 2012; New Listings in January 2013 were down 20% to January 2012; Month’s Supply of Total Listings is down to 8 Months from 9 (Buyer’s Market).
Vancouver Eastside Condos: Total Units Sold in January 2013 was 57 – up from 53 in December 2012; New Listings in January 2013 were up 10% to January 2012; Month’s Supply of Total Listings stayed at 8 (Buyer’s Market).
North Vancouver Houses: Total Units Sold in January 2013 was 52 – up from 32 in December 2012; New Listings in January 2013 were up 19% to January 2012; Month’s Supply of Total Listings is down to 6 Months from 9 (Balanced Market).
North Vancouver Condos: Total Units Sold in January 2013 was 38 – up from 34 in December 2012; New Listings in January 2013 were down 19% to January 2012; Month’s Supply of Total Listings stayed at 9 (Buyer’s Market).
West Vancouver Houses: Total Units Sold in January 2013 was 38 – up from 29 in December 2012; New Listings in January 2013 were down 16% to January 2012; Month’s Supply of Total Listings is down to 11 Months from 14 (Buyer’s Market).
Richmond Houses: Total Units Sold in January 2013 was 63 – up from 44 in December 2012; New Listings in January 2013 were down 24% to January 2012; Month’s Supply of Total Listings is down to 13 Months from 19 (Buyer’s Market).
Richmond Condos: Total Units Sold in January 2013 was 59 – up from 54 in December 2012; New Listings in January 2013 were down 25% to January 2012; Month’s Supply of Total Listings is down to 12 Months from 14 (Buyer’s Market).
Sales stats for the month of December 2012
Happy New Year! Attached are the end of December 2012 Sales and Listings Stats. The New Year started as they typically do, with less homes listed for sale. Total Residential Active Listings in Greater Vancouver are down 30% from November 30, 2012. Total properties listed for sale during December were down 49% to November 2012 and down 16% to December 2011. While sales in December are down from November 2012 and December 2012, we’ve seen that through 2012 so it is not news.
Perspective is the key. Where prices go is anyone’s guess. But considering the financial crisis of 2008 didn’t cause widespread panic selling and significant price drops, than what will? People need bigger homes, people need smaller homes, renters want to own and immigration into Vancouver leads to more buyers. As always, the focus will shift from where prices are going to making your living situation better. As we go forward people will get back to doing what they want and need to do: Moving!
Greater Vancouver: Total Units Sold in December 2012 was 1,171 – down from 1,733 in November 2012; and down from 1,700 in December 2011; Month’s Supply of Total Residential Listings is at 12 Months (Buyer’s Market).
Vancouver Westside Houses: Total Units Sold in December 2012 was 49 – down from 77 in November 2012; and down from 62 in December 2011; Total Active Listings as of January 2013 are down 29% from November 2012; Month’s Supply of Total Active Listings is at 14 Months (Buyer’s Market).
Vancouver Westside Condos: Total Units Sold in December 2012 was 156 – down from 241 in November 2012; and down from 262 in December 2011; Total Active Listings as of January 2013 are down 46% from November 2012; Month’s Supply of Total Active Listings is at 10 Months (Buyer’s Market).
Vancouver Eastside Houses: Total Units Sold in December 2012 was 54 – down from 91 in November 2012; and down from 95 in December 2011; Total Active Listings as of January 2013 are down 34% from November 2012; Month’s Supply of Total Active Listings is at 9 Months (Buyer’s Market).
Vancouver Eastside Condos: Total Units Sold in December 2012 was 53 – down from 69 in November 2012; and up from 51 in December 2011; Total Active Listings as of January 2013 are down 32% from November 2012; Month’s Supply of Total Active Listings is at 8 Months (Buyer’s Market).
North Vancouver Houses: Total Units Sold in December 2012 was 32 – down from 60 in November 2012; and down from 53 in December 2011; Total Active Listings as of January 2013 are down 39% from November 2012; Month’s Supply of Total Active Listings is at 9 Months (Buyer’s Market).
North Vancouver Condos: Total Units Sold in December 2012 was 34 – down from 59 in November 2012; and down from 62 in December 2011; Total Active Listings as of January 2013 are down 32% from November 2012; Month’s Supply of Total Active Listings is at 9 Months (Buyer’s Market).
West Vancouver Houses: Total Units Sold in December 2012 was 29 – down from 32 in November 2012; and down from 38 in December 2011; Total Active Listings as of January 2013 are down 31% from November 2012; Month’s Supply of Total Active Listings is at 14 Months (Buyer’s Market).
Richmond Houses: Total Units Sold in December 2012 was 44 – down from 76 in November 2012; and down from 62 in December 2011; Total Active Listings as of January 2013 are down 32% from November 2012; Month’s Supply of Total Active Listings is at 19 Months (Buyer’s Market).
Richmond Condos: Total Units Sold in December 2012 was 54 – down from 81 in November 2012; and down from 75 in December 2011; Total Active Listings as of January 2013 are down 29% from November 2012; Month’s Supply of Total Active Listings is at 14 Months (Buyer’s Market).
Sales stats for the month of November 2012
And to be prepared,
you need the stats! The REAL stats, not the news from the media. Attached are
the end of November Sales and Listings Stats. While the total number of units
sold was down in November compared to October 2012, we are seeing the total
number of active listings continue to decrease and the number of properties
being listed each month decrease. Total Active Listings as of December 1, 2012
are down 14% compared to June 1, 2012, while during the same period in 2011
total active listings were only down 8%. Benchmark Prices continue to drop in
all areas – with the biggest declines occurring in Detached Houses on
Vancouver’s West Side and West Vancouver.
Greater Vancouver: Total Units Sold in November 2012 was 1,733 – down from 1,970 in October 2012; New Listings in November 2012 were down 36% to October 2012; Month’s Supply of Total Residential Listings is up slightly to 10 Months (Buyer’s Market).
Vancouver Westside Houses: Total Units Sold in November 2012 was 77 – down from 104 in October 2012; New Listings in November 2012 were down 30% to October 2012; Month’s Supply of Total Active Listings is up to 11 Months (Buyer’s Market).
Vancouver Westside Condos: Total Units Sold in November 2012 was 241 – down from 264 in October 2012; New Listings in November 2012 were down 42% to October 2012; Month’s Supply of Total Active Listings is steady at 8 Months (Buyer’s Market).
Vancouver Eastside Houses: Total Units Sold in November 2012 was 91, steady from 93 Sold in October 2012; New Listings in November 2012 were down 48% to October 2012; Month’s Supply of Total Active Listings is steady at 7 Months (Trending on Balanced).
Vancouver Eastside Condos: Total Units Sold in November 2012 was 69 flat to October 2012 at 70; New Listings in November 2012 were down 34% to October 2012; Month’s Supply of Total Active Listings is steady at 8 Months (Buyer’s Market).
North Vancouver Houses: Total Units Sold in November 2012 was 60, down from 78 in October 2012; New Listings in November 2012 were down 36% to October 2012; Month’s Supply of Total Active Listings is steady at 6 Months (Balanced Market).
North Vancouver Condos: Total Units Sold in November 2012 was 59, up from 56 in October 2012; New Listings in November 2012 were down 40% to October 2012; Month’s Supply of Total Active Listings is down to 7 Months (Buyer’s to Balanced Market).
West Vancouver Houses: Total Units Sold in November 2012 was 32, down from 32 in October 2012; New Listings in November 2012 were down 46% to October 2012; Month’s Supply of Total Active Listings is up to 16 Months (Buyer’s Market).
Richmond Houses: Total Units Sold in November 2012 was 76, flat to October 2012 at 79 Sold; New Listings in November 2012 were down 34% to October 2012; Month’s Supply of Total Active Listings is down to 12 Month’s (Buyer’s Market).
November 2012 Sales and Listings Stats Regional
November 2012 Sales and Listings Stats Houses Townhouses and Condos
Sales stats for the month of October 2012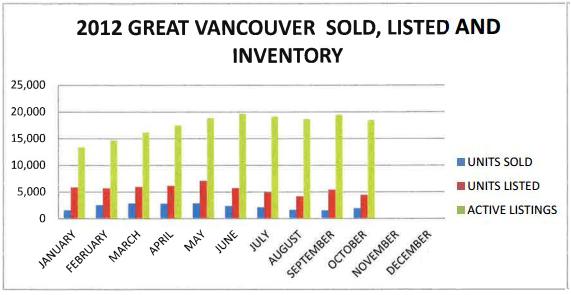
Greater Vancouver: Total Units Sold in October 2012 was 1,970 – up 28% to September 2012; New Listings in October 2012 were down 18% to September 2012; Month’s Supply of Total Residential Listings is down to 9 Months (Buyer’s Market).
Vancouver Westside Houses: Total Units Sold in October 2012 was 104 – up 21% to September 2012; New Listings in October 2012 were down 30% to September 2012; Month’s Supply of Total Active Listings is down to 9 Months (Buyer’s Market).
Vancouver Westside Condos: Total Units Sold in October 2012 was 264 – up 25% to September 2012; New Listings in October 2012 were down 3% to September 2012; Month’s Supply of Total Active Listings is down to 8 Months (Buyer’s Market).
Vancouver Eastside Houses: Total Units Sold in October 2012 was 93, up 26% to September 2012; New Listings in October 2012 were down 86% to September 2012; Month’s Supply of Total Active Listings is down to 7 Months (Trending on Balanced).
Vancouver Eastside Condos: Total Units Sold in October 2012 was 70 flat to September 2012; New Listings in October 2012 were down 28% to September 2012; Month’s Supply of Total Active Listings is 8 Months (Buyer’s Market).
North Vancouver Houses: Total Units Sold in October 2012 was 78, up 77% to September 2012; New Listings in October 2012 were down 39% to September 2012; Month’s Supply of Total Active Listings dropped to 6 Months (Balanced Market).
North Vancouver Condos: Total Units Sold in October 2012 was 56, up 30% to September 2012; New Listings in October 2012 were down 39% to September 2012; Month’s Supply of Total Active Listings is down to 8 Months (Buyer’s Market).
West Vancouver Houses: Total Units Sold in October 2012 was 51, up 19% to September 2012; New Listings in October 2012 were down 31% to September 2012; Month’s Supply of Total Active Listings is 11 Months (Buyer’s Market).
Richmond Houses: Total Units Sold in October 2012 was 79, up 54% to September 2012; New Listings in October 2012 were down 15% to September 2012; Month’s Supply of Total Active Listings is down to 13 Month’s (Buyer’s Market).
October 2012 Sales and Listings Stats Regional Townhouses and Condos
Sales stats for the month of September 2012
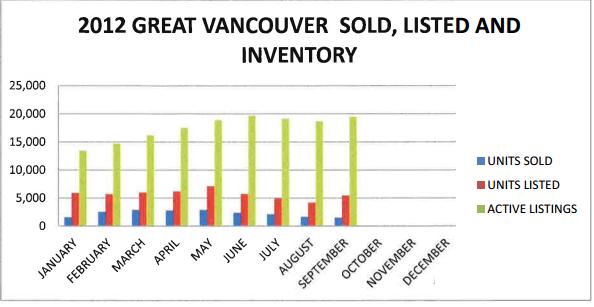
Sales and listings statistics are out for September. While the numbers show a September not to remember – perspective is the key. Over the last 25 years, September has more often than not shown lower units sold than August. September is a transition month, as much in life as in real estate. Activity in the real estate market did increase week by week as we moved through September. Over 1000 listings came off the market as October 1st appeared, with many more inactive listings on the market – buyers are engaging those listings coming on that are priced sharply leaving a bulk of listings sitting quiet. Benchmark prices in all areas have seen declines since their peak this year showing that Sellers will have to be reactive in their pricing going forward. And Buyers have their opportunity!
Greater Vancouver: Total Units Sold in September 2012 was 1,536 – down 8% to August 2012; New Listings in September 2012 were down 6% to September 2011; Month’s Supply of Total Residential Listings is 13 Months (Buyer’s Market).
Vancouver Westside Houses: Total Units Sold in September 2012 was 86 – up 15% to August 2012; New Listings in September 2012 were down 16% to September 2011; Month’s Supply of Total Active Listings is 12 Months (Buyer’s Market).
Vancouver Westside Condos: Total Units Sold in September 2012 was 212 – down 14% to August 2012; New Listings in September 2012 were down 13% to September 2011; Month’s Supply of Total Active Listings is 10 Month’s (Buyer’s Market).
Vancouver Eastside Houses: Total Units Sold in September 2012 was 74, down 6% to August 2012; New Listings in September 2012 were down 10% to September 2011; Month’s Supply of Total Active Listings is 10 Month’s (Buyer’s Market).
Vancouver Eastside Condos: Total Units Sold in September 2012 was 71 down 5% to August 2012; New Listings in September 2012 were down 6% to September 2011; Month’s Supply of Total Active Listings is 8 Months (Buyer’s Market).
North Vancouver Houses: Total Units Sold in September 2012 was 44, down 14% to August 2012; New Listings in September 2012 were up 9% to September 2011; Month’s Supply of Total Active Listings is 11 Month’s (Buyer’s Market).
North Vancouver Condos: Total Units Sold in September 2012 was 43, down 10% to August 2012; New Listings in September 2012 were down 3% to September 2011; Month’s Supply of Total Active Listings is 11 Months (Buyer’s Market).
West Vancouver Houses: Total Units Sold in September 2012 was 43, up 79% to August 2012; New Listings in September 2012 were up 2% to September 2011; Month’s Supply of Total Active Listings is 13 Months (Buyer’s Market).
Richmond Houses: Total Units Sold in September 2012 was 54, down 10% to August 2012; New Listings in September 2012 were down 27% to September 2011; Month’s Supply of Total Active Listings is 21 Month’s (Heavy Buyer’s Market!!!).
Richmond Condos: Total Units Sold in September 2012 was 73, up 12% to August 2012; New Listings in September 2012 were down 31% to September 2011; Month’s Supply of Total Active Listings is 13 Months (Buyer’s Market).
September 2012 Sales and Listings Stats Houses Townhouses and Condos
Sales stats for the month of August 2012
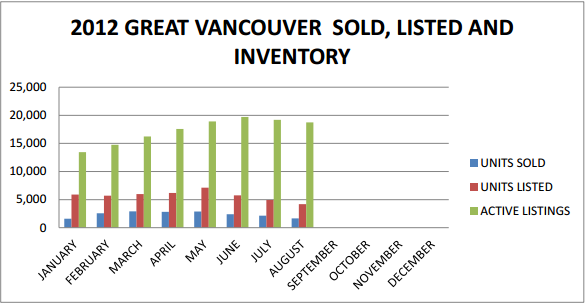
Attached are the listings and sales stats for the end of August. For the 4th straight month, the number of new listings coming on the market fell. August was reported to be one of the drier and hotter Augusts on record, so not surprisingly buyers’ and sellers’ attention was turned elsewhere than real estate. This was particularly evident in North Vancouver and West Vancouver where the market traditionally is quieter in the summer months. Overall markets showed a better absorption rate than in previous months which is a good sign that buyers are engaging. With a significant amount of pent up demand activity should pick up this month. Average prices in all areas were higher in August compared to June and July – not indicative of pricing but showing that buyers were engaging in more than entry level properties. But pricing will continue to be the focus going forward – well priced properties will continue to attract buyers.
Some examples of the latest activity:
Greater Vancouver: Total Units Sold in August 2012 were 1,670 – down 22% to July 2012; New Listings in August 2012 were down 15% to July 2012; Month’s Supply of Total Residential Listings is 11 Months (Buyer’s Market).
Vancouver Westside Houses: Total Units Sold in August 2012 were 75 – down 10% to July 2012, down 51% to March 2012; New Listings in August 2012 were down 17% to July 2012; Month’s Supply of Total Active Listings is 13 Months (Buyer’s Market!).
Vancouver Westside Condos: Total Units Sold in August 2012 were 247 – down 11% to July 2012, down 37% to March 2012; New Listings in August 2012 were down 20% to July 2012; Month’s Supply of Total Active Listings is 8 Month’s (Buyer’s Market).
Vancouver Eastside Houses: Total Units Sold in August 2012 were 79, down 28% to July 2012, down 49% to March 2012; New Listings in August 2012 were down 19% to June 2012; Month’s Supply of Total Active Listings is 9 Month’s (Buyer’s Market).
Vancouver Eastside Condos: Total Units Sold in August 2012 were 75 down 28% to July 2012; New Listings in August 2012 were down 8% to July 2012; Month’s Supply of Total Active Listings is 7 Months (Hanging on to a Balanced Market, trending towards Buyer’s Market).
North Vancouver Houses: Total Units Sold in August 2012 were 51, down 15% to July 2012, down 58% to March 2012; New Listings in August 2012 were down 7% to July 2012; Month’s Supply of Total Active Listings is 8 Month’s (Buyer’s Market).
North Vancouver Condos: Total Units Sold in August 2012 were 99, down 13% to July 2012; New Listings in August 2012 were down 29% to July 2012; Month’s Supply of Total Active Listings is 9 Months (Buyer’s Market).
West Vancouver Houses: Total Units Sold in August 2012 were 24, down 48% to July 2012; down 69% to March 2012; New Listings in August 2012 were down 17% to July 2012; Month’s Supply of Total Active Listings is 22 Months (Buyer’s Market).
Richmond Houses: Total Units Sold in August 2012 were 60, the same as July 2012, down 32% to March 2012; New Listings in August 2012 were down 18% to July 2012; Month’s Supply of Total Active Listings is 19 Month’s (Heavy Buyer’s Market!!!).
August 2012 Sales Stats Regional
August 2012 Sales Stats Houses Townhouses and Condos
Sales stats for the month of July 2012
For the 3rd straight month, new listings during the month fell in all areas. Total units sold were also down compared to June. So while we can’t always soar with the eagles, sometimes it is ok to coast in the valleys. Those that price their properties competitively and below the last sale price have a better chance to sell, and those buyers that engage active sellers have a better chance to create lower selling prices and buy a new home!
Some examples of the latest activity:
Greater Vancouver: Total Units Sold in July 2012 were 2,135 – down 11% to June 2012; New Listings in July 2012 were down 14% to June 2012; Month’s Supply of Total Residential Listings is 9 Months (Buyer’s Market).
Vancouver Westside Houses: Total Units Sold in July 2012 were 83 – down 19% to June 2012, down 45% to March 2012, and down 70% to March 2011; New Listings in July 2012 were down 18% to June 2012; Month’s Supply of Total Active Listings is 13 Months (Buyer’s Market!).
Vancouver Westside Condos: Total Units Sold in July 2012 were 276 – down 17% to June 2012, down 30% to March 2012, and down 52% to March 2011; New Listings in July 2012 were down 14% to June 2012; Month’s Supply of Total Active Listings is 8 Month’s (Buyer’s Market).
Vancouver Eastside Houses: Total Units Sold in July 2012 were 109, 2% higher than June 2012, down 30% to March 2012, and down 52% to March 2011; New Listings in July 2012 were down 15% to June 2012; Month’s Supply of Total Active Listings is 7 Month’s (Balanced trending to Buyer’s Market).
Vancouver Eastside Condos: Total Units Sold in July 2012 were 104 down 24% to June 2012; New Listings in July 2012 were down 32% to June 2012; Month’s Supply of Total Active Listings is 5 Months (Balanced Market).
North Vancouver Houses: Total Units Sold in July 2012 were 60, down 18% to June 2012, down 50% to March 2012, and down 55% to March 2011; New Listings in July 2012 were down 27% to June 2012; Month’s Supply of Total Active Listings is 7 Month’s (Balanced trending to Buyer’s Market).
North Vancouver Condos: Total Units Sold in July 2012 were 55, down 20% to June 2012; New Listings in July 2012 were down 14% to June 2012; Month’s Supply of Total Active Listings is 9 Months (Buyer’s Market).
Richmond Houses: Total Units Sold in July 2012 were 60, down 21% to June 2012, down 42% to March 2012, and down 73% to March 2011; New Listings in July 2012 were down 8% to June 2012; Month’s Supply of Total Active Listings is 20 Month’s (Heavy Buyer’s Market!!!).
JULY 2012 Sales Stats Regional
JULY 2012 Sales Stats Houses Townhouses and Condos